Lockhart Capital – Year End 2017

In the Lockhart Private Investment Office, we try to avoid making predictions for the year ahead. The future is essentially unforecastable, and the subsequent market reaction to events can be equally unpredictable – for example, markets rose, contrary to expectation, on both the UK Referendum result and the US Presidential election, both of which were also a surprise at the
time.
Barry Ritholz, the well-known (in the US) investor and Bloomberg commentator, makes the point that “Around this time of year, a full field of foolish forecasts find their way to the public…. they ignore how much variability and randomness is in future outcomes.” One well known bank has a habit of getting “stopped out” of its “Top Trades for the year”, usually long before the end of January.
This being said, there is clearly no harm in re-capping the economic and investment environment as we see it at Lockhart Capital. We also like to consider how we did each year against the
prevailing opportunity set.
In 2017, the process was correct to stay fully invested, and our diversifiers did diversify/control risk. The one shame was the opportunity that failed to occur. That is, we had long felt that
there might be a third quarter sell-off for which we could be a buyer, but the consolidation in the markets in August proved small, and there was no real opportunity to put more capital to
work at attractive valuation levels.
Most of investors’ macro worries failed to come to pass, as European elections did not deliver the Far-Right shocks that had been feared, the US did not create material protectionist problems, North Korea has not yet destabilised its neighbours, and China got a grip on parts of its economy while negotiating a successful “soft landing” from 2016 into 2017. This is a good example of the “problem with macro” in that in most years it is just noise that is best ignored (some will be lured into overtrading).
The socio-political backdrop is also always important to reflect upon. Dissatisfied voters in the Western World are being drawn to “change”, whatever the vehicle for that may be, and identity politics is increasingly taking hold. We do seem to be at one of those inflexion points whereby the redistribution of wealth is considered before, and more important, than the initial generation of that wealth (and perhaps is no surprise given the exacerbation of wealth, if not income, inequality generated by Quantitative Easing). This may result in an environment of trying times for growing invested capital, and preserving the post-tax purchasing power of wealth.
Most of our clients are sterling based or at least have predominantly sterling liabilities, and so this issue particularly resonates, given the possibilities currently inherent in UK politics,
and with the case for entrepreneurial capitalism – as opposed to corporatism – rarely being made.
2017 was also the year where crypto-currencies went mainstream (sort of). We expect that many if not most of them will revert to a value of zero. We had started to consider whether a small holding in a number of them – for Adventurous investors – might be appropriate, if and when the appropriate regulatory infrastructure and tax policy certainty arrived, back when Bitcoin was trading between $600 and $700. We never thought that it would be nearer $18,000 by now, that the Daily Telegraph would have a live Bitcoin price tracker, and that “Crypto-Kitties” would be changing hands for $100,000 (in Ether tokens).
Ken Rogoff, a Professor of Economics at Harvard, wrote that “the long history of currency tells us that what the private sector innovates, the state eventually regulates and appropriates – and there is no reason to expect virtual currency to avoid a similar fate.” This would perhaps be the ultimate irony, given the decentralized and libertarian origins and intent of digital currencies.
Entering the New year our key concern remains the same. Extraordinary central bank policies have allowed for a vast misallocation of capital. Quantitative easing has not shown up in consumer inflation statistics, but is most apparent in asset price inflation (“too much money chasing too little cashflow”, as Pinebridge have put it), from traditional markets to Art, Bitcoin, Wine and so on, as is the lack of the cleansing “creative destruction” which follows most recessions and in itself is part of the recovery process.
The consequent high market and valuation levels (see Fig. 1) have caught out those fundamental investors who have been overly defensively positioned for the last five years. It is important to
understand that there are various regimes under which investors have typically paid up (/overpaid) for a “dollar of earnings”. These have tended to be i) when economic growth is stable, ii) when
interest rates (and inflation) are low, and iii) when profit margins are high (despite their mean reverting tendencies).

We have had all these regimes coinciding, and exacerbated by the wall of new money created by the central banks. Therefore, it should be less of a surprise that markets are able to exist at the valuations we see today. You don’t have to like this though, and one certainly should expect future market returns to be disappointing, especially with that Quantitative Tightening to come.
Every day there is $3bn of bond buying by the world’s central banks. However, by this time next year, it will be $2bn per day of selling, as “Quantitative Tightening” really starts to take effect, and which will have profound implications beyond this one asset class.
For almost a decade now the risk-free rate, from which almost every asset is priced, has been manipulated, anesthetized, and suppressed. The question has been: will the central banks lose control of the bond markets, and if so, when? This is yet to happen, which has allowed the state of affairs to persist. The Lockhart process suggested a fully invested portfolio through 2017, not because there was a clear valuation opportunity, but instead because indicators of market conditions remained benign, and our five “Signals” were identifying circumstances appropriate for “taking the risk of risk”, via our adaptive risk profiles.
For now, this has worked in our favour (“process beats analysis by a factor of 6” (Lovallo and Sibony)), as did our view that 2017 could surprise the consensus in terms of economic activity – it
is ending with strong synchronised global growth (although this hasn’t impacted bond yields as one might have expected). Indeed, even UK growth will close to match 2016’s, easily surpassing expectations from the start of the year, and in line with its potential.
We use the chart in Figure 2 as a good measure of economic activity in the US. It shows Railcar Loadings and the Truck Tonnage (ATA) Index since 2000, and essentially captures the quantum of “stuff” being moved around over there. You can see the acceleration over the last year or so, on the right of the chart.
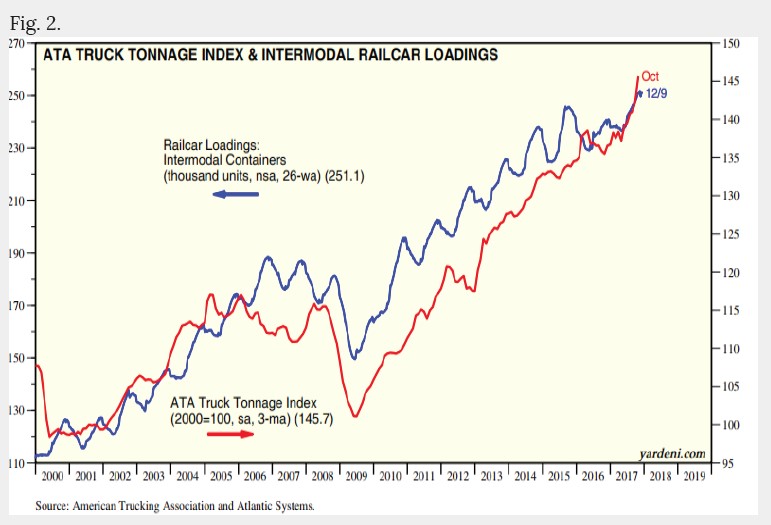
These kinds of objective measures often give a better view of what is actually going on at ground level, than a month’s worth of economists’ pontificating, or central bank-approved statistics. In any event, it had appeared to us that the world was in a better place than popularly imagined, and commodity prices were picking up, giving us some comfort that our process was on the right track.
Now, a quick look at prospective returns. We can think of the 10 Year US Treasury Bond, as the “Risk Free rate”, and at the least as a quality government bond that yields more than equivalents in
the UK, Japan and Europe. We can also use history to estimate its likely future return (Fig. 3).

Essentially what this chart is showing is the real return one might expect from such a bond purchase (y axis), given various levels of prevailing yield (x axis). The red dot shows where we are today,
and is suggesting zero real returns, perhaps less, over the next ten years. Corporate debt might be nearer a 2% return, but obviously carries credit and liquidity risk.
Most investors have forgotten what a bond bear market looks like, or at least have not invested through such a time. Helpfully, the circumstances of the 1965-1970 sell-off are quite like today
(low inflation, low unemployment). The bond market in the US, lost 36% in real terms, over this period, after Chairman Martin started raising rates in December 1965, as inflation (deemed
to be under the cosh), surprisingly started to rise. The other tantalising parallel to today is that the US budget deficit was rather slipping out of control, due to Lyndon Johnson’s tax
reforms, and the costs of the Vietnam War.
Today we see the US budget deficit rolling over again (see Fig. 4), and to be exacerbated by the Tax Reform package (depending on when and if you believe it will “pay for itself”).

Moving on to equities; the chart on page 1 (Fig. 1) shows the “price to sales ratio” (a mechanism for valuation) for the US market, which is matching its all-time highs from the Technology
bubble in 2000. A similar result can be obtained by using Warren Buffett’s favoured “market cap to GDP” ratio, and is considerably worse when considering the median (/average) stock in the
market rather than the market per se. These measures are of little use as timing tool, but hint at the scale of the potential market fall as and when the next downturn arrives, as well as supporting the thesis of below average expected future returns over time.
However, better starting valuations are on offer in, for example, the Emerging Markets, and hence superior expected returns (if concomitant extra risk too). Nevertheless, the point is that both equities and bonds, in general, will do extremely well to generate significant positive real returns, going forward, if owned passively.
That is to say, via a passive vehicle (ETF or tracker) or a de facto passive strategy, i.e. running a portfolio with a static level of risk, and accepting the prevailing market returns. It is unlikely
that stock or fund selection could overcome the ensuing disappointing result, especially as such selection tends to be predicated on historic performance that, empirically, does not replicate itself into the future.
We don’t mean to beat up on tracker funds and ETFs, on the contrary we use them extensively in the LCM service. In fact, Bloomberg Gadfly’s Nir Kassir has shown that in the 10 years to July 2017, passive investors captured 96% of their fund’s returns, whereas active investors captured just 71% (as they bought high and sold low) – there isn’t a problem with active management per se, just some active managers, and the way that investors, on average, use them.
No, the issue with passive investment right now is that even if you perfectly capture your “beta” or the return of the underlying index you are tracking, this is then not much good if that return over 10 years is zero, and is extremely unhelpful if it is say minus 50%, over any period, as simply finding a particularly cheap and efficient way to halve your wealth is really no achievement at all. In our view it is now absolutely crucial to have a strategy that has an-at-least-decent-chance of making materially positive real returns over the next decade, given prevailing conditions, and perhaps especially as one doesn’t know what will happen to the value of cash (/sterling) and any potential future changes to the taxation system in the UK.
So, the valuation of markets has changed, but as has their microstructure (via the domination of algorithms and passive investment), and a sound investment strategy also needs to adapt with that. Our industry runs the risk of failing to grow clients’ wealth, over and above inflation, as many have not evolved a strategy for creating returns from the likely future environment. If we are proven overly-cautious, and capital markets continue to appreciate, then fortunately the Lockhart process is designed to capture that too – we do try and avoid single scenario investing, and aim to perform in a wide variety of different circumstances. Most bear markets end up “repossessing” around half the gains of the previous bull, which in the case of where we find ourselves in January 2018, is rather a lot. We bought a chunk of additional risk assets for clients in November 2008, and then again in autumn 2011 (though nothing since) and the subsequent gains need to be somewhat defended we feel, whilst recognizing the futility of exact market timing, and the likely counter-productive nature of disinvesting entirely.
In conclusion, we are wary of investor expectations being too optimistic for 2018 – valuations contract and bond yields push out, in most rising interest rate cycles – and continue to see below average long-term prospects for markets and traditional strategies. We suspect that to maximise investment success one will need an adaptive risk profile, and to be able to embrace and profit from a return of volatility to markets, and the trending nature of different market “regimes”. We, as ever, remain vigilant, dispassionate observers upon our clients’ behalf, and with “strong views loosely held”.
Andrew Wilson, Chief Investment Officer
The content of this newsletter is for information only. It does not represent personal advice or a personal recommendation, and should not be interpreted as such. Please do not act upon any part of it without first having consulted an Independent Financial Adviser.